


In order to create a Gantt chart in Excel, start by listing your project tasks along with their start and finish dates. The key takeaway here is by doing this, one forms the basis of your visual project schedule.
Typically, use the Insert Bar Chart function, choosing the Stacked Bar chart option to simulate a Gantt chart structure. It’s obvious that the bars' length should reflect the task duration. What’s obvious is to track your progress easily, format this stacked bar chart by adjusting the colors and labels to differentiate between tasks.
The cool thing is, if one reverses the task order, one ensures a traditional Gantt chart view.
At last– use the Format Axis option to fine-tune your dates. One thing is for sure: For aiding in project scheduling, a well-prepared Gantt chart is essential.
Introduction to Gantt Charts
It's no secret that this chart is a crucial tool used in project scheduling. Plus, it helps to track your progress and the start and finish dates of tasks. The fascinating aspect about this chart is it provides a simple project schedule through visual representation of project tasks.
There is no doubt that the chart can also be created using predefined Gantt chart types such as the Stacked Bar chart. .
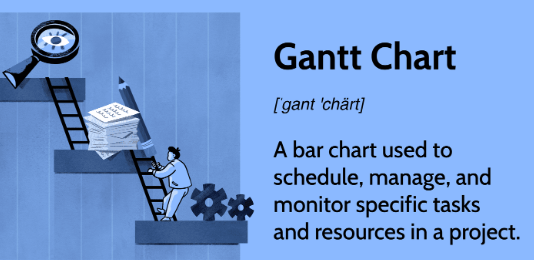
What is a Gantt Chart?
We know that a Gantt chart is a visual tool used in project management to easily track your progress and represent the simple project schedule. The remarkable aspect of this chart is it is primarily focused on the start and finish dates of tasks within a project.
The cool thing is to better understand the progress of project tasks, one can do the following things here:-
- Formatting the stacked bar chart
- Reverse the task order
- Manipulation of the view with the Format Axis function
Why Use a Gantt Chart?
It's an undeniable truth that a Gantt chart is a useful tool to simulate a project schedule. What’s more about this tool is it assists users in keeping track of project tasks and the duration of each task. With the predefined Gantt chart type, one can efficiently monitor the start and finish dates of tasks.
It's worth noting that the Gantt uses a Stacked Bar chart to represent task data, which makes it a simple tool for project scheduling. Definitely the best thing about this is it is highly flexible as well as customizable.
Understanding Excel for Gantt Charts
It's obvious that Excel simplifies project scheduling through its functionalities for creating these charts. Obviously, these charts are vital in mapping out the start and finish dates of tasks within a particular project.
Notably, they're constructed using an Insert Bar Chart function to simulate a Gantt chart, although Excel doesn't contain a predefined Gantt chart type.
It's significant to note that in creating a Gantt chart in Excel, one require task data that includes task start dates and task duration. Generally, to have a clearer view of your tasks; one may need to reverse the task order, which can be done by adjusting the Format Axis option.
Excel's role in creating Gantt Charts
One thing is for sure: Excel plays a crucial role in creating Gantt charts, which are vital for project scheduling. The enlightening part is that one can simulate a Gantt chart using Excel's predefined Gantt chart type, and then transforming it into a Stacked Bar chart. This process requires one to do the following things:-
- Input project tasks
- Start and finish dates of tasks
- Task duration
It's interesting to point out that Excel helps one track your progress by allowing one to format the stacked bar chart. The key takeaway is it also gives one an option to reverse the task order using Format Axis.
Benefits of using Excel for Gantt Charts
It's crucial to be aware that using Excel for these charts is beneficial for project scheduling because it allows one to easily track your progress and define the start and finish dates of tasks. The standout feature about Excel is it is flexible and versatile which offers a predefined Gantt chart type to simplify your project schedule.
Typically, with the use of Excel; one gets a clear visual representation of task duration, task data, etc. all in one place.
Step-by-step guide to creating a Gantt Chart in Excel
Note that In Excel, start creating a Gantt chart by entering your project tasks, task start dates, and the duration of each task in a data table. Usually, while Excel does not provide a predefined Gantt chart type, one can simulate a Gantt chart using the Stacked Bar chart feature.
It's a matter of fact that proceeding by selecting your table data and choosing 'Insert Bar Chart,' then selecting 'Stacked Bar Chart' is a good start.
Step 1: setting up your project data
There is no denying that setting up your project data is fundamental to maintaining a simple project schedule. Begin by listing your project tasks, noting down the start and finish dates of tasks. As a result, this will aid in simulating a Gantt chart, which is vital for project scheduling.
Typically, using a tool that offers a predefined chart type amplifies efficiency while helping you track your progress aptly.
What's interesting is that proper formatting of the stacked bar chart is necessary, occasionally requiring one to reverse the task order for visual clarity.
Step 2: creating a stacked bar chart
Definitely, to create a stacked bar chart, one should begin by selecting the task data, task start dates, and task duration in your simple project schedule. The obvious thing is if one goes to "Insert Bar Chart" and chooses the Stacked Bar chart option; he will simulate a Gantt chart using a predefined Gantt chart type.
It’s well known that this form of visual representation helps to track your progress at a glance. To enhance the visibility of tasks, format the stacked bar chart. For instance, one may wish to reverse the task order by choosing the "Format Axis" option. Surprisingly, applying such techniques to your bar chart can greatly enhance your project scheduling abilities!
Step 3: formatting the Gantt Chart
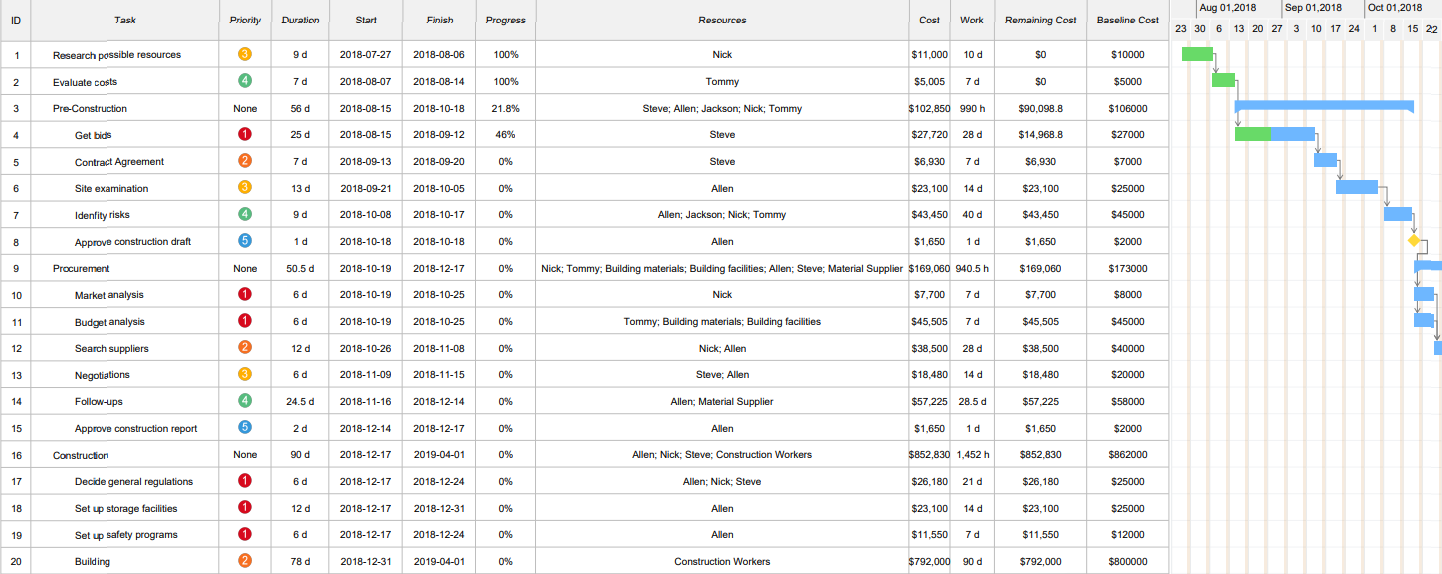
It's crucial to be aware that the formatting of the Gantt chart starts with choosing the predefined Gantt chart type in your software. When one inserts the Bar Chart, preferably the Stacked Bar chart, it simulates the Gantt chart. What’s notable is the bars in this chart represent the project tasks, illustrated in line with the start and finish dates of the tasks. Plus, their lengths represent the task duration.
One thing is proven: inputting the task data– the important information about task start dates and their durations is a good practice. It’s no secret that formatting should be done to ensure clarity. Mostly, a well-formatted Gantt chart allows for a simple project schedule, facilitating efficient project scheduling. Please always format the stacked bar chart for easy readability.
Step 4: adding task details
Notably, start by adding:-
- The project tasks
- Task start dates
- Task duration
This is a good first step. The notable thing about tracking your progress is it indicates the start and finish dates of tasks. From this task data, a simple project schedule can be prepared. As a consequence, this will help in better project scheduling.
Inserting a bar chart to simulate a Gantt chart is an absolute genius move. Dive into the predefined Gantt Chart or a Stacked Bar Chart, and format it to match your project's requirements. You can even reverse the task order to fit your project flow using the Format Axis option. This customization helps you better manage and visualize your project's timeline, making your project management experience smoother and more exciting!
Advanced Gantt Chart techniques in Excel
It's significant to note that advanced Gantt chart techniques in Excel enhance the ability to monitor project tasks, track your progress, and simulate the simple project schedule. What’s obvious is this critical point involves a predefined Gantt chart type. For creating this, input the start and finish dates of tasks. Then, insert a bar chart and convert it to a stacked bar chart.
It's interesting to point out that inputting task data such as task duration and task start dates into the chart is a good practice. The remarkable aspect about mastering these advanced techniques is they can significantly improve your project scheduling ability in Excel.
Using conditional formatting in Gantt Charts
It's worth noting that conditional formatting in these Charts is a method that allows customization of the chart based on task data. The notable thing about this is it provides a visual way to track your progress and can highlight the following things
- Project tasks
- Their duration
- The start and finish dates of tasks
This helps to create a simple project schedule.
It's indisputable that for creating a Gantt chart, one can insert a bar chart or a stacked bar chart, simulate the chart through a predefined Gantt chart type. And, then format the stacked bar chart as per your need.
Obviously, tools like 'Format Axis' in Excel can help one reverse the task order and alter the overall presentation of the chart. Inarguably, conditional formatting helps to visualize data in a simpler form.
Adding milestones to your Gantt Chart
One thing is for sure: adding milestones to your Gantt chart helps one track your progress and stay on top of project tasks. These milestones act as checkpoints that indicate the start and finish dates of tasks. It’s astounding how this provides a simple project schedule that can be easily interpreted! Plus, one can add these to the predefined Gantt chart type by inserting a bar chart or stacked bar chart.
It's a matter of fact that once you've added your task data; one can format the stacked bar chart to simulate a Gantt chart. Usually, the customization options available depend on the project management software or tool you're using.
Common challenges and solutions when creating Gantt Charts in Excel
Creating Gantt Charts in Excel can be notoriously difficult, especially when it comes to arranging and inputting task data. Users frequently face frustration while trying to insert project tasks, set their start and finish dates, and accurately estimate task duration.
A major drawback is the difficulty of simulating a Gantt chart with the basic "Insert Bar Chart" tool; particularly when it comes to reversing the task order or formatting the axis.
However, the good news is there are solutions to these issues. Instead of using Excel's predefined Gantt chart type, one can create a more functional one using the Stacked Bar chart. This format lets one indicate your project scheduling and track your progress with higher precision.
Dealing with complex projects
There is no doubt that complex projects often require a detailed approach to keep track of your progress. The notable thing is breaking down the project into a list of individual tasks. Insert a Bar Chart or a predefined Gantt chart type for each task. What’s more is that the Gantt chart can simulate the start and finish dates of tasks according to a simple project schedule.
It's also necessary to note that formatting the stacked bar chart for better visualization is crucial. The key takeaway is one might need to reverse the task order or adjust the Format Axis based on your task data.
Updating Gantt Charts as projects evolve
Obviously, updating Gantt charts allows for adjustments and modifications as project tasks evolve. Note that it provides a simple project schedule, visualizing the start and finish dates of tasks.
Commonly, one can choose a predefined Gantt chart type or simulate your own, incorporating task data that best suits your workflow. Features such as the Insert Bar Chart or Stacked Bar Chart provide graphical representations of task duration.
Alternatives to Excel for creating Gantt Charts
It’s fascinating to find out there are several alternatives to Excel for creating Gantt charts. These tools, like Microsoft Project and TeamGantt, let you simulate Gantt charts by incorporating start and finish dates of tasks effortlessly.
This makes managing project tasks and tracking progress as easy as pie!
What's really intriguing is that these tools come with integrated functionalities. You can insert a bar chart, create a stacked bar chart, and even format it to suit your needs.
Microsoft Project: a more advanced option
Looking for a more advanced way to handle project tasks? Microsoft Project is an absolute game-changer for tracking progress and creating seamless project schedules! This tool also lets you insert bar charts or stacked bar charts.
With MS Project, users can reverse the task order with the 'Format Axis' feature. It’s amazing how this ensures their project flow is just the way they wanted it.
But it’s not all sunshine and rainbow while using MS Project as an alternative to Excel. Many users have found MS Project to be notoriously complicated. Even seasoned professionals reportedly struggle to grasp its intricacies without investing hours in training
The user interface is particularly challenging to navigate. Many have complained about its poor visualization. The worst part is this makes the tool significantly harder to use.
Online tools: Bonsai, Trello and Asana

Track your progress and streamline project scheduling with online tools such as Bonsai, Asana and Trello. It's a matter of fact that these platforms allow one to do the following things:-
- Manage project tasks
- Set start and finish dates of tasks
- Budget tracking
- Client Management
- Financial Management:
- Reporting and Accounting
A good feature in these tools is the predefined Gantt chart type. It helps visualize your project timeline and task start dates.
It comes as no surprise that there are various options available for simulating a Gantt chart, such as: the Insert Bar Chart, Stacked Bar Chart, and more.
The best thing about these tools are they excel at integrating task data seamlessly into the project portfolio
Conclusion: maximizing the effectiveness of your Gantt Charts
One thing is for sure: Maximizing the effectiveness of your Gantt charts can streamline project tasks and track your progress in a visual manner.
It's no secret that one can format a stacked bar chart and insert it into a predefined Gantt chart type. The noteworthy element about utilizing the formatting axis and reversing the task order is it allows for an efficient way to represent task start dates along with the task duration.
There is no doubt that regular updating and analyzing of task data is necessary for effective project scheduling.


'%3e%3cg id='Final-Copy-2_2_' transform='translate(1275.000000, 200.000000)'%3e%3cpath class='st0' d='M7.4,12.8h6.8l3.1-11.6H7.4C4.2,1.2,1.6,3.8,1.6,7S4.2,12.8,7.4,12.8z'/%3e%3c/g%3e%3c/g%3e%3c/g%3e%3cg id='final---dec.11-2020'%3e%3cg id='_x30_208-our-toggle' transform='translate(-1275.000000, -200.000000)'%3e%3cg id='Final-Copy-2' transform='translate(1275.000000, 200.000000)'%3e%3cpath class='st1' d='M22.6,0H7.4c-3.9,0-7,3.1-7,7s3.1,7,7,7h15.2c3.9,0,7-3.1,7-7S26.4,0,22.6,0z M1.6,7c0-3.2,2.6-5.8,5.8-5.8 h9.9l-3.1,11.6H7.4C4.2,12.8,1.6,10.2,1.6,7z'/%3e%3cpath id='x' class='st2' d='M24.6,4c0.2,0.2,0.2,0.6,0,0.8l0,0L22.5,7l2.2,2.2c0.2,0.2,0.2,0.6,0,0.8c-0.2,0.2-0.6,0.2-0.8,0 l0,0l-2.2-2.2L19.5,10c-0.2,0.2-0.6,0.2-0.8,0c-0.2-0.2-0.2-0.6,0-0.8l0,0L20.8,7l-2.2-2.2c-0.2-0.2-0.2-0.6,0-0.8 c0.2-0.2,0.6-0.2,0.8,0l0,0l2.2,2.2L23.8,4C24,3.8,24.4,3.8,24.6,4z'/%3e%3cpath id='y' class='st3' d='M12.7,4.1c0.2,0.2,0.3,0.6,0.1,0.8l0,0L8.6,9.8C8.5,9.9,8.4,10,8.3,10c-0.2,0.1-0.5,0.1-0.7-0.1l0,0 L5.4,7.7c-0.2-0.2-0.2-0.6,0-0.8c0.2-0.2,0.6-0.2,0.8,0l0,0L8,8.6l3.8-4.5C12,3.9,12.4,3.9,12.7,4.1z'/%3e%3c/g%3e%3c/g%3e%3c/g%3e%3c/g%3e%3c/svg%3e)