


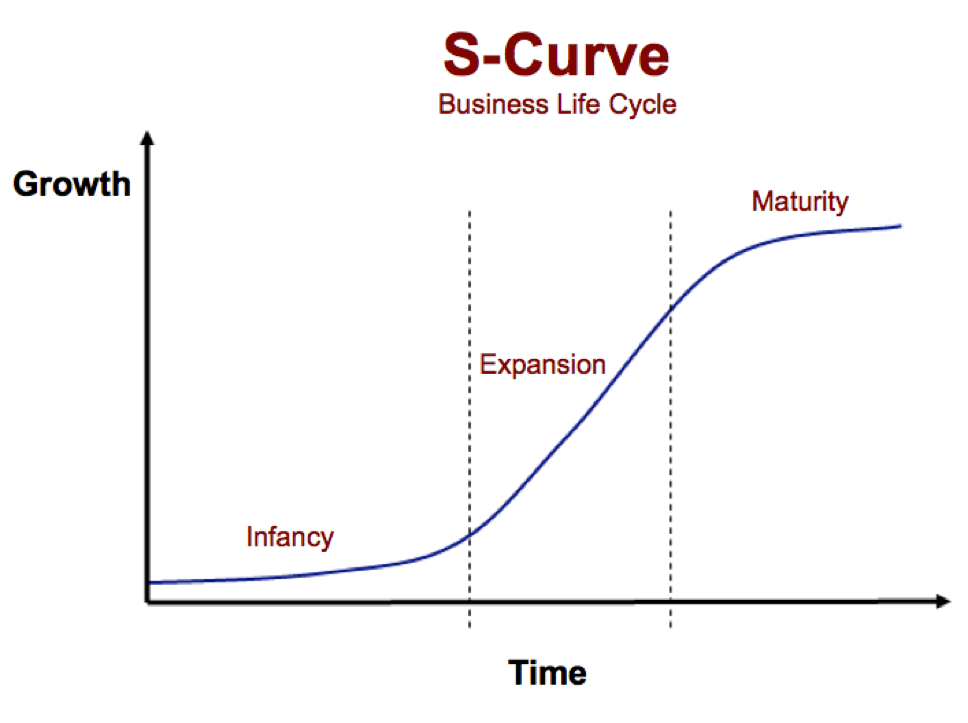
The S-curve is a game-changer across multiple industries, like project management and construction. Picture this: a simple graph plotting how a project grows or progresses over its life cycle. It kicks off slowly, gains momentum, peaks, and then tapers off as the project wraps up.
This curve isn’t just for show; it's crucial for tracking performance, setting a baseline schedule, gauging costs, and managing cash flow. It compares your production schedule with the target S-curve, giving you a clear view of real-time progress.
Product s curve introduction
In project management, the S-curve is a powerhouse tool. It shows project progress over time, using a graph to depict cumulative costs, performance, and cash flow at various stages. Think of it as a 'slow-fast-slow' format—momentum builds at the start, peaks mid-project, then slows as things wrap up. Whether it's a baseline or target S-curve, it offers insights that are gold in construction management.
Product s curve definition and basics
The S-curve, simply put, is a visual representation of a project’s life cycle. It maps out how scope, time, and cost shift from start to finish.
You’ll see costs and schedules plotted over this curve. In both general and construction project management, the S-curve is your go-to for tracking momentum, spotting peaks, and forecasting completion. Two key types of S-curves are:
- The baseline S-curve for planned progress
- The target S-curve for actual results
It’s all about keeping tabs on performance and cash flow.
Applications of the product S-curve in technology evolution
Understanding the product S-curve in technology development
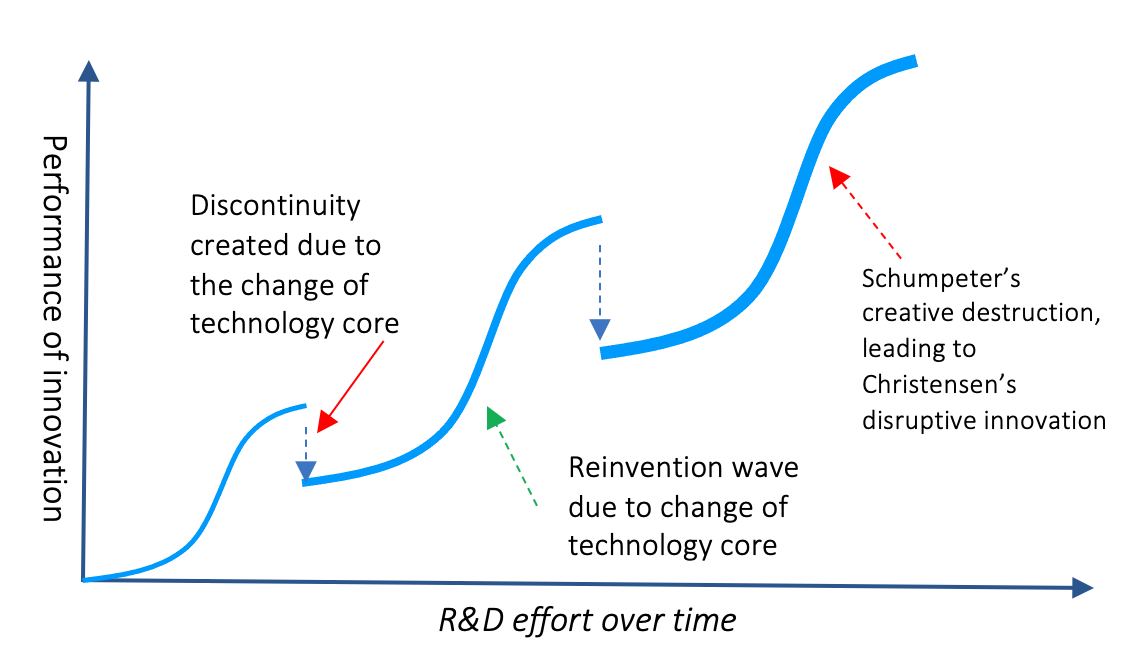
The product S-curve models how a technology evolves through stages of slow growth, rapid improvement, and eventual maturity. This curve helps businesses anticipate when a product will reach its performance limits and when innovation will slow down. For example, early smartphones followed an S-curve where initial adoption was slow, then rapidly increased as features improved, before plateauing as the market matured.
Recognizing where a technology sits on the S-curve allows freelancers and small business owners to time their investments and product launches strategically. If a technology is near the plateau phase, it may be wise to explore emerging alternatives rather than pushing incremental upgrades. This approach reduces the risk of investing in outdated tech.
To apply this, track industry reports and product performance data regularly. Tools like Gartner’s Hype Cycle and CB Insights provide insights into technology maturity. Using these resources helps you make informed decisions about when to innovate or pivot your offerings.
How the product S-curve guides innovation strategy
The product S-curve informs innovation by highlighting the need to shift focus before a technology plateaus. For instance, personal computers followed an S-curve where rapid improvements in processing power and design eventually slowed, prompting companies to invest in mobile computing and cloud technologies. This shift is critical to staying competitive.
Small businesses can use the S-curve to plan product development cycles. When a product reaches the top of the curve, it’s time to explore new features, alternative technologies, or entirely new products. This proactive approach prevents stagnation and keeps your offerings relevant in fast-changing markets.
Start by mapping your current products against the S-curve stages. Use customer feedback and performance metrics to identify slowing growth. Then allocate resources to research and development for next-generation solutions. This strategy ensures your business adapts before market demand declines.
Examples of product S-curve in technology evolution
The evolution of personal computers (PCs) is a classic example of the product S-curve. Early PCs had limited capabilities and slow adoption, representing the curve's initial phase. The rapid improvements in processing speed, storage, and user interfaces marked the steep growth phase. Today, PCs face a plateau as smartphones and tablets dominate, signaling the maturity phase.
Another example is electric vehicles (EVs). Early EVs struggled with battery life and cost, but recent advances have accelerated growth. The S-curve predicts that as battery technology matures, innovation may slow, pushing manufacturers to explore new materials or alternative energy sources like hydrogen fuel cells.
By studying these examples, freelancers and small business owners can better anticipate technology shifts. This foresight allows timely adaptation of services or products, such as offering EV charging solutions as the EV market grows or developing apps optimized for emerging devices.
Using the product S-curve to make business decisions
Applying the product S-curve helps freelancers and small businesses decide when to invest in new technology or phase out old products. For example, if your software tool is nearing the plateau phase, it might be time to develop new features or pivot to a different market segment to maintain growth.
Monitoring your product’s position on the S-curve can also guide marketing strategies. Early-stage products require education and awareness campaigns, while mature products benefit more from differentiation and customer retention efforts. Adjusting your approach based on the curve stage optimizes resource use.
To implement this, regularly review sales data, customer feedback, and competitor activity. Combine this with industry trend analysis to update your product roadmap. This ongoing evaluation ensures your business stays aligned with technology evolution, maximizing growth opportunities.
Product s curve historical background
Dating back to the early 20th century, the S-curve has been a staple in project management. Originally, it helped track performance against a baseline schedule. Over the years, variations like the baseline and target S-curves emerged, each serving unique purposes within a project’s life cycle. Today, it’s a vital tool for predicting peaks, managing cash flow, and ensuring projects stay on track.
Product s curve in business and economics
The S-curve isn’t just a project management tool; it's a visual roadmap for a project’s journey from start to finish. It’s especially handy for evaluating performance and guiding construction projects. The curve starts slow, accelerates to a peak, then decelerates toward completion.
You’ll encounter three main types of S-curves: the baseline, project costs, and target S-curves. The baseline S-curve, aligned with the original schedule, acts as a benchmark. The project S-curve tracks cash flow over time. The target S-curve shows where the project should be heading.
Role of product s curve in business growth and development
In business growth, the S-curve represents progress over time within a project’s life cycle. It’s widely used in project management, particularly in construction, to keep an eye on performance, costs, and momentum. The curve has three main phases: a slow start, rapid growth, and a plateau leading to completion.
Different S-curves, like the baseline and target types, ensure your production schedule aligns with the baseline. Plus, they help with cash flow forecasting, allowing organizations to anticipate needs and allocate resources wisely.
Application of product s curve in economic forecasting
The S-curve is more than a project management graph; it’s a tool for economic forecasting. It shows progress against the baseline schedule and is key for understanding momentum at various project stages. From inception to completion, the S-curve helps analyze performance, costs, and cash flow. In economic forecasting, it acts as a crystal ball for predicting peaks and adjusting schedules. By comparing actual progress with the target S-curve, you can spot discrepancies and make necessary adjustments.
How to create a product s curve on Bonsai?
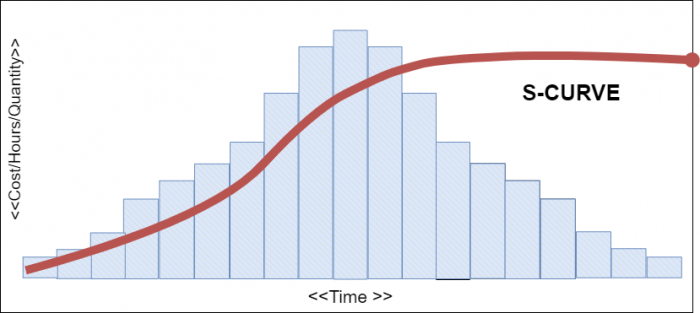
Creating an S-curve in the Bonsai project management tool involves several steps to effectively visualize project progress and forecast potential outcomes. An S-curve is a graphical representation of cumulative data, such as cost or man-hours, plotted against time. It helps project managers track the progress of a project and identify any deviations from the planned schedule.
To create an S-curve in Bonsai, start by gathering all relevant project data. This typically includes timeframes, budget allocations, resource availability, and project milestones. Once you have this data, you can begin inputting it into Bonsai. Navigate to the project you are working on and access the task management or project tracking section.
In Bonsai, you can use the Gantt chart feature to organize your tasks and milestones. This feature allows you to visualize the timeline of your project and see how tasks overlap. To create an S-curve, you will need to track the cumulative progress of these tasks over time. You can do this by setting up a custom field to record the cumulative data for each task.

Next, use Bonsai's reporting or analytics tools to generate the S-curve. Select the data you have inputted and choose the appropriate chart type, which in this case is the S-curve. Customize the chart to fit your needs, such as adjusting the time intervals or adding labels for clarity.
Once your S-curve is generated, you can use it to monitor the project's progress. The S-curve will show you the planned progress versus the actual progress, allowing you to identify any discrepancies early on. This can help you make informed decisions to keep the project on track.
By following these steps, you can create an S-curve in Bonsai to effectively manage and visualize your project's progress.
Product s curve in project management
The S-Curve is a mathematical graph used in project management to show project progress and estimate momentum. It includes the baseline S-Curve, representing the baseline schedule, and the target S-Curve, symbolizing the production schedule. These curves are essential for efficient construction project management.
As a project moves through its life cycle, it peaks before declining towards completion. The S-Curve helps evaluate performance, monitor costs, and predict cash flow. It’s a vital tool for visualizing and communicating expected and actual progress.
How to use product s curve in project scheduling?
In project management, the S-Curve is a graph that shows progress over time. It’s often used in construction project management to visually represent performance against the baseline schedule.
The S-Curve highlights three key stages in the project life cycle:
- Initiation
- Planning
- Execution
- Closure
- The initial period of slow momentum.
- The peak indicates the highest level of activity.
- The tapering off towards completion.
By tracking costs and cash flow, the target S-Curve helps maintain the production schedule within desired parameters.
Benefits of product s curve in project management
The S-Curve offers several benefits. It effectively depicts progress, allowing managers to gauge momentum, foresee the peak, and predict completion timing. The baseline and target S-Curves help monitor performance against the baseline schedule, ensuring better control over costs throughout the project life cycle.
Whether in construction or other fields, using the S-Curve aids in modeling and managing cash flow, streamlining the production schedule for maximum efficiency.
Product s curve in product life cycle
The S-Curve in the product life cycle is a graph used to map progress and ascertain momentum. It provides a visual comparison between the baseline schedule and the actual production schedule. The curve ascends and reaches the peak, demonstrating progress until completion. This model also shows costs and cash flow during the project life cycle.
The S-Curve is particularly useful in construction project management, aiding in evaluating performance and managing the target S-Curve effectively.
How product s curve helps in product development
The S-Curve is a significant tool in project management. It illustrates progress, giving a clear image of momentum and performance over the project life cycle. The baseline S-Curve reflects the initial plan, while the target S-Curve represents the desired completion path.
Using the S-Curve aids in maintaining the production schedule and managing costs. It can also provide valuable foresight into possible cash flow issues—a critical element in construction project management. Hence, it helps ensure a project reaches peak performance and completion on time and within budget.
Role of product s curve in product maturity and decline stages
The S-Curve represents progress over time, exhibiting three key phases: acceleration, deceleration, and steady-state. This curve is crucial when monitoring performance during the product maturity and decline stages.
From a baseline schedule perspective, the S-Curve indicates momentum initially escalating until it hits the peak, then decelerating toward completion. This decline aligns with reducing cash flow and costs, showing the diminished resources allocated towards the end of the project life cycle.
Understanding the S-Curve is vital in construction project management as it provides an optimal production schedule and a basis for developing a target S-Curve, offering a realistic view of anticipated progress and budgetary expectations.
Product s curve in marketing
In project management, the S-Curve is a graph depicting progress over time. It shows how a project progresses from zero activity to peak momentum and gradually slows down towards completion. The curve shows performance against the baseline schedule.
The project life cycle is divided into stages: initiation, planning, execution, and closure. The baseline S-Curve acts as a visual measure of the planned production schedule, actual progress, and target S-Curve. It’s an effective tool for tracking costs, performance, and cash flow, especially in construction project management.
How to apply product s curve in market penetration strategies?
The S-Curve is crucial in project management, illustrating progress and measuring performance against the baseline schedule. It aids in maintaining momentum and identifying a project’s peak. With a clear visual of the production schedule and costs, the S-Curve helps predict cash flow and completion dates efficiently.
In market penetration strategies, the S-Curve provides a graph of a product’s life cycle. This is instrumental in construction project management, guiding the creation of a target S-Curve and providing milestones to achieve market dominance.
How to use product s curve to predict consumer adoption rates?
The S-Curve is powerful in predicting consumer adoption rates. This graph visually represents progress and momentum over the project life cycle. It helps managers track performance against the baseline and production schedules.
The S-Curve provides insights into costs and cash flow and is widely used in construction project management. Its shape illustrates an initial slow adoption (development phase), followed by rapid adoption (peak), and finally a slowdown as the product saturates the market (completion). The target S-Curve reflects the ideal scenario, while the baseline S-Curve shows actual performance.
Product s curve in innovation
The S-curve is a key tool in innovation management, acting as a mathematical graph to track project progress over time. It manages the entire project life cycle, from the initial momentum to the peak and eventual completion. The baseline S-curve sets your production schedule and helps control costs.
In construction project management, the S-curve is also handy for forecasting cash flow and comparing actual performance against the target S-curve. Mastering this tool can lead to smoother project execution and fewer surprises.
How product s curve influences innovation management
When managing innovation, the S-curve is more than just a graph—it is a roadmap. It tracks project progress, showing how momentum builds from the start, peaks, and tapers off near completion. The baseline S-curve represents planned performance, the target S-curve tracks the production schedule, and project costs must be monitored. These elements help track cash flow and allow adjustments if the project deviates, which is essential in construction project management.
Case study of Apple Inc. and product s curve
Apple Inc. has nailed the use of the S-curve in project management. The company uses this graph to predict progress and fine-tune its production schedule. By keeping a close eye on project momentum, peak phases, and completion, Apple stays ahead of the curve.
Key to Apple’s success is efficient life cycle management, adhering to the baseline S-curve, and maintaining strict control over costs and cash flow.
Product s curve in environmental science
In environmental science, the S-curve is a go-to tool for visualizing project progress throughout its life cycle. This mathematical graph is crucial in construction project management, helping track performance against targets and manage cash flow. The S-curve starts slow, builds to a peak, and flattens as the project concludes.
How to use product s curve in population ecology?
In population ecology, the S-curve offers a visual map of project progress over time. It is invaluable in project management, especially in construction, where it tracks momentum from start to peak to finish. Comparing baseline and target S-curves highlights deviations in the production schedule, making it easier to manage costs and cash flow.
How to apply product s curve in environmental impact assessment?
The S-curve plays a critical role in environmental impact assessments by visualizing project progress and performance over time. It is used to track cumulative costs and project momentum, helping predict peaks and completion points. In construction project management, this tool is vital for spotting deviations from the baseline schedule, stabilizing cash flow, and minimizing environmental impact.
Conclusion on the versatility of product s curve
The S-curve is a versatile tool in project management, offering a visual representation of progress and momentum. The baseline S-curve helps set the production schedule and forecast costs. The target S-curve evaluates performance against the plan. This tool is essential for managing the project life cycle, cash flow, and ensuring timely completion, particularly in construction management.
The S-curve is a cornerstone of project management, providing a visual guide to project progress and momentum. This mathematical graph tracks the entire life cycle from start to finish and continuously compares actual performance with the baseline S-curve. It is particularly valuable in construction management, where it helps analyze costs, cash flow, and potential project peaks. This allows timely adjustments to the production schedule.
Looking ahead, the S-curve will remain a critical tool in project management. As technologies advance, more sophisticated methods will emerge for analyzing project progress and costs. Aligning the target S-curve more closely with the baseline could improve cash flow management and overall project efficiency. The future is bright for this proven tool.


'%3e%3cg id='Final-Copy-2_2_' transform='translate(1275.000000, 200.000000)'%3e%3cpath class='st0' d='M7.4,12.8h6.8l3.1-11.6H7.4C4.2,1.2,1.6,3.8,1.6,7S4.2,12.8,7.4,12.8z'/%3e%3c/g%3e%3c/g%3e%3c/g%3e%3cg id='final---dec.11-2020'%3e%3cg id='_x30_208-our-toggle' transform='translate(-1275.000000, -200.000000)'%3e%3cg id='Final-Copy-2' transform='translate(1275.000000, 200.000000)'%3e%3cpath class='st1' d='M22.6,0H7.4c-3.9,0-7,3.1-7,7s3.1,7,7,7h15.2c3.9,0,7-3.1,7-7S26.4,0,22.6,0z M1.6,7c0-3.2,2.6-5.8,5.8-5.8 h9.9l-3.1,11.6H7.4C4.2,12.8,1.6,10.2,1.6,7z'/%3e%3cpath id='x' class='st2' d='M24.6,4c0.2,0.2,0.2,0.6,0,0.8l0,0L22.5,7l2.2,2.2c0.2,0.2,0.2,0.6,0,0.8c-0.2,0.2-0.6,0.2-0.8,0 l0,0l-2.2-2.2L19.5,10c-0.2,0.2-0.6,0.2-0.8,0c-0.2-0.2-0.2-0.6,0-0.8l0,0L20.8,7l-2.2-2.2c-0.2-0.2-0.2-0.6,0-0.8 c0.2-0.2,0.6-0.2,0.8,0l0,0l2.2,2.2L23.8,4C24,3.8,24.4,3.8,24.6,4z'/%3e%3cpath id='y' class='st3' d='M12.7,4.1c0.2,0.2,0.3,0.6,0.1,0.8l0,0L8.6,9.8C8.5,9.9,8.4,10,8.3,10c-0.2,0.1-0.5,0.1-0.7-0.1l0,0 L5.4,7.7c-0.2-0.2-0.2-0.6,0-0.8c0.2-0.2,0.6-0.2,0.8,0l0,0L8,8.6l3.8-4.5C12,3.9,12.4,3.9,12.7,4.1z'/%3e%3c/g%3e%3c/g%3e%3c/g%3e%3c/g%3e%3c/svg%3e)