


A PICK Chart is a tool of Lean Six Sigma under process improvement concepts for effectual project management. It supports the Identify and Prioritize Opportunities Phase by placing action items in a visual comparison, known as the Impact Effort Matrix, by their impact and ease of implementation.
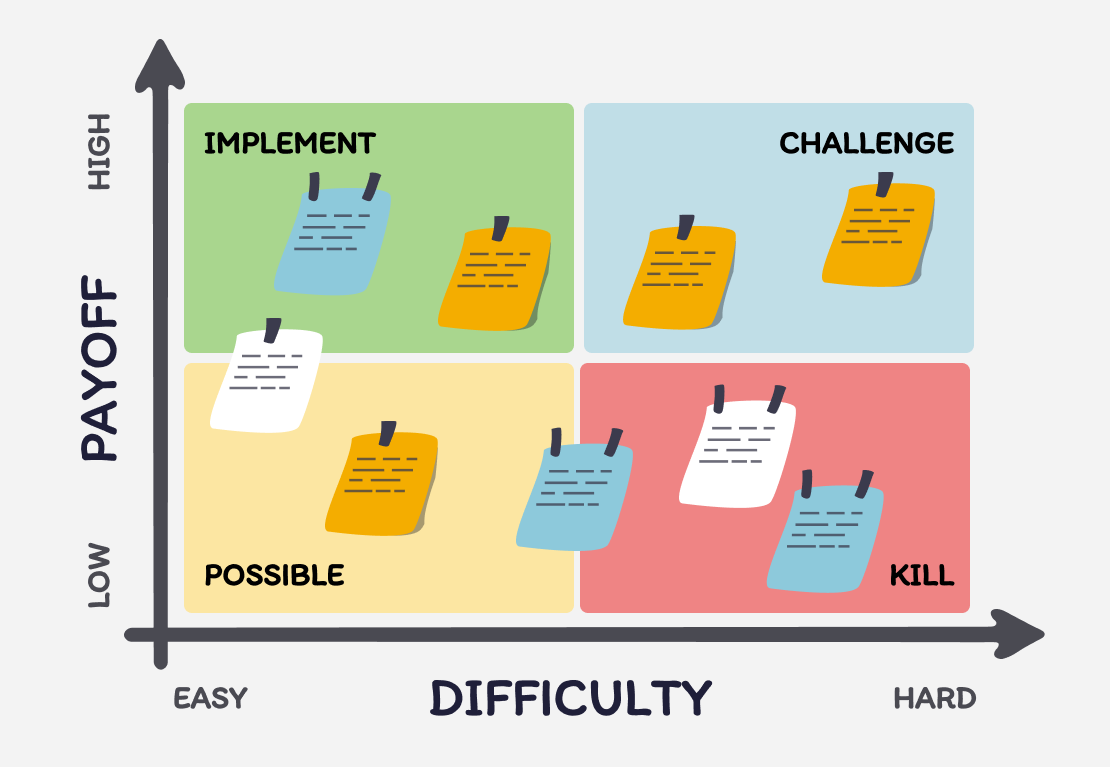
The quadrants of the PICK Chart are Plan, Implement, Challenge, and Kill. Through these quadrants, it is possible to view the potential return on investment of a project. The PICK Chart forms an integral part of Lean Manufacturing and Six Sigma methodologies to assure comprehensive and guided decision-making.
Pick chart introduction
A PICK Chart or Impact-Effort Matrix is a very useful Lean Six Sigma tool regularly used in both Lean Manufacturing and Six Sigma to sort process improvement ideas as part of Phase 2: Identify and Prioritize Opportunities. PICK stands for Possible, Implement, Challenge, and Kill, representing ranges on the matrix. As a chart, it gives a visual comparison of potential return on investment versus ease or cost of implementation. This helps with efficient strategizing of action items.
In a PICK Chart, improvement ideas are plotted according to the impact and effort applied, availing a simple but very effective way to prioritize and manage such projects according to their feasibility and potential impact. The matrix speeds up not only the selection process but also assists in aligning business needs with betterment initiatives.
What is a pick chart?
A PICK Chart is a simple tool usable in Lean Six Sigma and other process improvement methodologies to categorize process improvement ideas and isolate priority action items. The name PICK stands for Possible, Implement, Challenge, and Kill, which represent the different category options the tool offers.
This chart also represents an Impact Effort Matrix, or Ease Impact Matrix, which contrasts the ideas and their potential impact with the ease or cost of implementation. This visual comparison would assist greatly in the phase of identifying and prioritizing opportunities and thereby maximizing return on investment in lean manufacturing.
What is the origin of the pick chart?
A PICK chart is a graphical tool in organizing ideas, developed as part of Lean Manufacturing and Six Sigma methodologies. The methodologies reduce the complication in the manufacturing process of the product and also reduce wastage by improving the return on investment. The PICK chart helps in categorizing and placing the ideas of improvement in order of importance, making them easy to implement.
This tool uses an Impact Effort Matrix that visually compares possible actions. It is vital in the Identify and Prioritize Opportunities phase. This matrix helps classify action items according to expected impact and ease or cost of implementation in process improvement projects.
Pick chart components
A PICK chart is a Lean Six Sigma tool used in the Identify and Prioritize Opportunities Phase for process improvement ideas. It stands for Possible, Implement, Challenge, and Kill, which categorize action items based on impact and ease or cost of implementation. The chart consists of two axes: the vertical axis, known as the Impact Effort Matrix, represents possible return on investment; the horizontal axis, known as the Ease Impact Matrix, represents ease of implementation. This comparative visual tool facilitates arranging improvement ideas. It helps teams make decisions about implementation and ensures resources are used to maximize benefits with minimal effort.
What are the four quadrants of a pick chart?
Definition: The Four Quadrants is a basic Lean Six Sigma tool that is used by process improvement techniques like Lean Manufacturing and Six Sigma. It is made up of the following two tools:
- Impact Effort Matrix
- Ease Impact Matrix
Both of these matrices are used to categorize and prioritize items based on ease or cost of implementation as well as potential return on investment. During the Identify and Prioritize Opportunities Phase of every process improvement effort, both matrices provide a visual comparison. By examining ideas against these parameters, organizations can deploy the most appropriate and achievable changes. The Four Quadrants tool is imperative for maximal efficiency and profit-making.
How to plot tasks on a pick chart
A PICK chart is a Lean Six Sigma tool used to categorize tasks or improvement ideas in the Identify and Prioritize Opportunities Phase. The return on investment for each action item is visualized by an Impact Effort Matrix, sometimes called an Ease Impact Matrix. The x-axis measures ease or cost of implementation, and the y-axis measures impact on process improvement. Start by identifying all possible action items, then place each in the matrix based on impact and ease of implementation. Quick visual comparisons help differentiate 'quick wins' from 'longer-term projects' and prioritize tasks, strengthening lean manufacturing and Six Sigma process improvements.
Benefits of pick charts in project management
A PICK chart, part of the Lean Six Sigma tool suite, effectively categorizes and prioritizes process improvement ideas during the Identify and Prioritize Opportunities phase of project management. It visually compares potential action items using an Impact Effort Matrix, which plots ease or cost of implementation against expected return on investment. Using PICK charts in project management, Lean Manufacturing, and Six Sigma projects streamlines decision-making, fosters transparency, and aligns efforts with business needs. This simplifies implementing improvements and optimizes resource allocation for maximum benefit.
The benefits of using Bonsai in project management are extensive and impactful for businesses seeking to optimize their operations. Bonsai's comprehensive suite of project management tools not only simplifies administrative tasks but also empowers teams to deliver successful projects with greater efficiency and control.
Enhanced decision-making process
Implementing a Lean Six Sigma tool within a company enhances the decision-making process. It uses methodologies like the Impact Effort Matrix, which helps categorize process improvement ideas based on impact and effort, providing a visual comparison. This enables effective action items during the Identify and Prioritize Opportunities phase. Such tools support Lean Manufacturing and Six Sigma principles, simplifying implementation and increasing return on investment. Improvement ideas focus on ease or cost of implementation. Decision-making becomes simplified but productive.
Improved project prioritization
The Lean Six Sigma tool Impact Effort Matrix improves project prioritization by categorizing and visualizing process improvement ideas based on return on investment and ease or cost of implementation. Implementing these strategies emphasizes action items needed in the Identify and Prioritize Opportunities Phase. The Ease Impact Matrix ensures a simplified yet visual comparison of project potentials based on ease of implementation and projected impact. Both Six Sigma and Lean Manufacturing principles simplify and improve the prioritization process, allowing more efficient resource use.
Increased team collaboration
Implementing Lean Six Sigma tools such as the Impact Effort Matrix aids the Identify and Prioritize Opportunities Phase by triggering deep improvement ideas. This increases collaboration among team members as action items become well defined and categorized. The visual comparison is based on the return on investment and ease or cost of implementation of each idea. Lean Manufacturing stimulates strategic discussion that enables team members to align their roles with broader organizational goals. This drives teamwork focused on ease of implementation and return on investment.
How to create a pick chart step by step

To create a PICK chart, which is a Lean Six Sigma tool used in Lean Manufacturing, the first step is to categorize and list your process improvement ideas based on their ease/cost of implementation and their potential return on investment using an Impact Effort Matrix. This matrix maps out the ideas based on their impact (vertical axis) and effort (horizontal axis).
The second step is to transfer these ideas onto the PICK (Possible, Implement, Challenge and Kill) chart for a visual comparison. This helps in the Identify and Prioritize Opportunities Phase of Six Sigma, assisting in the selection of high impact, low effort action items for implementation.
The PICK chart defines the quadrant in which each idea lies, allowing for easier analysis of its feasibility. It's a straightforward tool that helps clarify the ease of implementation and expected results of improvement ideas.
How to identify and list ideas
Implementing Lean Manufacturing and Six Sigma techniques are essential for successful process improvement. The Lean Six Sigma tool is particularly effective in the Identify and Prioritize Opportunities Phase. Using tools like the Impact Effort Matrix and Ease Impact Matrix allows for easy visualization and categorizing of potential improvement ideas based on their return on investment and ease/cost of implementation.
Listing down action items after visual comparison not only streamlines the process but also enables easy implementation. Highlighting these points, we can then discern the potential impact against the ease of implementation. These guidelines foster an environment that encourages growth and efficiency without overwhelming the system.
How to rank ideas based on impact and effort
Implementing Lean Six Sigma tools is crucial for categorizing and prioritizing process improvement ideas. The Impact Effort Matrix and Ease Impact Matrix offer a visual comparison of each action item based on effort and impact, aiding in the Identify and Prioritize Opportunities Phase of project planning.
Factors considered typically include ease of implementation and potential return on investment. Ranking each idea in this manner helps to forecast the ease/cost of implementation against potential benefits. In correlation to Lean Manufacturing and Six Sigma principles, this can streamline decision making, boost efficiency, and maximize productivity.
How to plot ideas on a pick chart
In Lean Manufacturing and the Six Sigma methodology, the PICK chart is a tool employed in the Identify and Prioritize Opportunities Phase. This Lean Six Sigma tool helps categorize process improvement ideas based on their ease of implementation and anticipated return on investment. It provides a visual comparison on the Impact Effort Matrix, including the Ease Impact Matrix.
The PICK chart can be used to sort out and prioritize action items, making it an effective tool for implementation. It allows for an objective evaluation of improvement ideas, crucial for maintaining the lean principle of eliminating waste and promoting efficiency.
Advanced pick chart techniques and customizations
weighted pick charts for prioritizing complex projects
Weighted pick charts assign different importance levels to criteria, helping you prioritize projects more accurately. Instead of treating all factors equally, you can give higher weights to elements like cost savings or customer impact based on your business goals. This method clarifies which projects deserve more attention when multiple factors compete.
To create a weighted pick chart, start by listing your evaluation criteria and assigning each a weight from 1 to 5 based on its significance. Then, score each project option against these criteria. Multiply the scores by their weights and sum them to get a weighted score for each project. Tools like Microsoft Excel and Google Sheets can automate these calculations using formulas, making it easier to update and compare results.
Using weighted pick charts helps freelancers and small business owners make data-driven decisions, especially when juggling several projects. For example, a graphic designer could weigh client urgency higher than project size to decide which jobs to accept first. Incorporate this technique to refine your prioritization and focus on what truly drives value.
digital tools for pick chart creation and customization
Several digital tools streamline the creation and customization of pick charts, saving time and enhancing clarity. Platforms like Miro, Lucidchart, and Canva offer templates specifically designed for pick charts, allowing you to drag and drop elements and adjust categories easily. These tools also support collaboration, enabling clients or team members to provide input in real time.
For freelancers managing multiple projects, integrating pick charts into tools like Trello or Asana can centralize your workflow. Using add-ons such as Trello's "Chart" power-up or Asana's custom fields, you can embed pick chart data directly within your project boards. This integration keeps prioritization visible alongside task management, improving transparency and focus.
To customize your pick chart effectively, experiment with color coding and labels that match your business context. For instance, use red to highlight high-impact but low-effort tasks or green for quick wins. Digital tools often allow exporting charts as PDFs or images, making it easy to share with clients or stakeholders for approval and feedback.
integrating pick charts with other project management tools
Integrating pick charts with project management software enhances decision-making by linking prioritization directly to execution. Tools like Monday.com and ClickUp support custom dashboards where you can embed pick charts alongside timelines, budgets, and resource allocations. This holistic view helps freelancers and small businesses align strategic priorities with daily tasks.
To integrate, start by exporting your pick chart data into CSV or Excel formats and import it into your project management platform’s custom fields or tables. Some software also supports API connections to sync pick chart updates automatically, reducing manual entry and errors. For example, ClickUp’s automation features can trigger task status changes based on pick chart scores, streamlining your workflow.
By combining pick charts with project management tools, you gain a dynamic system that adapts as project conditions change. This approach ensures your prioritization remains relevant, helping you allocate time and resources efficiently. Consider setting regular review intervals, such as monthly, to update your pick charts within your project software for continuous improvement.
Applications of pick charts across industries
Using pick charts in manufacturing to improve processes
Pick charts help manufacturing teams prioritize process improvements by categorizing ideas based on impact and ease of implementation. This visual tool allows teams to quickly decide which changes will deliver the most value with the least effort, streamlining continuous improvement initiatives.
For example, a factory might use a pick chart to evaluate options like upgrading machinery, adjusting workflows, or training staff. By plotting these ideas, the team can identify quick wins such as simple workflow tweaks that reduce downtime immediately, while scheduling more complex upgrades for later.
To apply this in your manufacturing business, gather your team for a brainstorming session, then use a digital tool like Miro or Lucidspark to create the pick chart. This approach ensures everyone understands priorities clearly and can focus resources on improvements that yield fast, measurable results.
How pick charts aid marketing teams in campaign planning
Marketing teams use pick charts to evaluate potential campaigns by balancing expected impact against resource requirements. This helps avoid overcommitting to complex campaigns with uncertain returns, focusing instead on initiatives that are both effective and feasible.
For instance, a small business might consider:
- Social media ads
- Email newsletters
- Influencer partnerships
- Event sponsorships
Plotting these on a pick chart reveals which campaigns can be launched quickly with a high chance of success, such as targeted social ads, versus longer-term efforts like event sponsorships.
Marketers can create pick charts using Excel or Google Sheets by assigning scores for impact and effort, then plotting ideas accordingly. This method supports data-driven decisions and efficient allocation of limited marketing budgets in 2024 and beyond.
Applying pick charts in healthcare to prioritize patient care improvements
Healthcare providers leverage pick charts to prioritize quality improvement projects that enhance patient outcomes while considering resource constraints. This ensures that initiatives with the greatest benefit and feasibility are implemented first.
For example, a clinic might assess options like updating patient intake forms, staff training on new protocols, or investing in telehealth technology. Using a pick chart, the team can identify easy-to-implement changes such as revising forms that improve data accuracy immediately, while planning for more resource-intensive projects later.
Healthcare managers can facilitate workshops to create pick charts and involve frontline staff in scoring ideas. This collaborative approach fosters buy-in and accelerates improvements that matter most to patient care quality in 2024.
Leveraging pick charts in small business operations for smarter decision-making
Small business owners can use pick charts to make smarter operational decisions by visually comparing the potential benefits and required effort of various projects. This helps avoid spreading resources too thin and focuses efforts on high-impact, manageable tasks.
For example, a freelancer might consider:
- Updating their website
- Launching a newsletter
- Investing in new software
Plotting these on a pick chart helps identify quick wins like website updates that improve client acquisition immediately, while deferring more complex software investments.
To implement this, freelancers and small businesses can use free tools like Canva or Trello to build pick charts. Regularly revisiting and updating the chart ensures ongoing alignment with business goals and efficient use of time and money in 2024.
Pick chart examples in real-world scenarios
In Lean Six Sigma, the PICK chart—also known as the 'Impact Effort Matrix'—is often used at the 'Identify and Prioritize Opportunities Phase'. It is a visual comparison tool that helps categorize process improvement ideas according to their ease and cost of implementation and their potential impact on business goals. This aids decision making and helps teams focus their efforts efficiently.
For example, in a Lean Manufacturing context, teams might use a PICK chart to evaluate improvement ideas, such as reducing production errors or implementing a new software system. Each idea is plotted based on perceived ease of implementation and estimated return on investment. This allows comparison of action items and determination of which to implement first.
How to use a pick chart in marketing campaigns
Using the PICK Chart, a Lean Six Sigma tool, in marketing campaigns can ease the implementation process and categorize ideas based on their impact and effort. During the Identify and Prioritize Opportunities Phase, strategic action items are reviewed and the return on investment from different tactics is visually compared.
Commonly used in Lean Manufacturing and Six Sigma, the Impact Effort Matrix filters improvement ideas by ease and cost of implementation contrasted with potential benefits. Marketers can use the PICK chart to streamline process improvement ideas and optimize campaigns.
How to apply a pick chart in product development
In product development, the PICK chart—an integral component of the Lean Six Sigma toolkit—is primarily used to categorize and prioritize process improvement ideas. It is a visual comparison tool, also known as the Impact Effort Matrix, that facilitates the implementation of Lean Manufacturing and Six Sigma principles. It helps identify and prioritize opportunities in the 'Identify and Prioritize Opportunities Phase'.
The PICK chart enables teams to arrange improvement ideas and action items based on ease and cost of implementation and expected return on investment. This aids in formulating an Ease Impact Matrix for each idea, leading to efficient resource allocation.
Overcoming common PICK chart challenges
Dealing with subjectivity in assessments
Subjectivity often clouds the evaluation process when using a PICK chart, leading to inconsistent prioritization. To reduce bias, involve a diverse group of stakeholders in scoring each idea using clear, predefined criteria such as cost, impact, and ease of implementation. For example, a small marketing agency might use a simple scoring rubric from 1 to 5 for each criterion and average the scores to maintain objectivity.
Using digital tools like Miro or Lucidspark can standardize the scoring process by allowing anonymous input and real-time aggregation. This minimizes dominant voices skewing results and encourages honest feedback. Additionally, revisiting the criteria periodically ensures they stay relevant as project goals evolve.
To tackle subjectivity effectively, establish transparent guidelines and document the rationale behind each score. This practice improves decision quality and builds trust among team members, making it easier to move forward with prioritized actions confidently.
Ensuring stakeholder buy-in
Securing stakeholder buy-in is critical for PICK chart success, as resistance can stall implementation. Start by involving key decision-makers early in the process and explain how the PICK chart simplifies complex choices and aligns efforts with business goals. For instance, a freelance web designer might present a PICK chart to a client to clarify which features deliver the most value within budget.
Communicate the benefits clearly, emphasizing transparency and collaborative decision-making. Hosting a short workshop or walkthrough session helps stakeholders understand how their input shapes priorities. Tools like Zoom or Microsoft Teams facilitate inclusive discussions, especially for remote teams.
Address concerns openly and be willing to adjust criteria or weights based on stakeholder feedback. This flexibility fosters ownership and encourages commitment to executing the chosen initiatives.
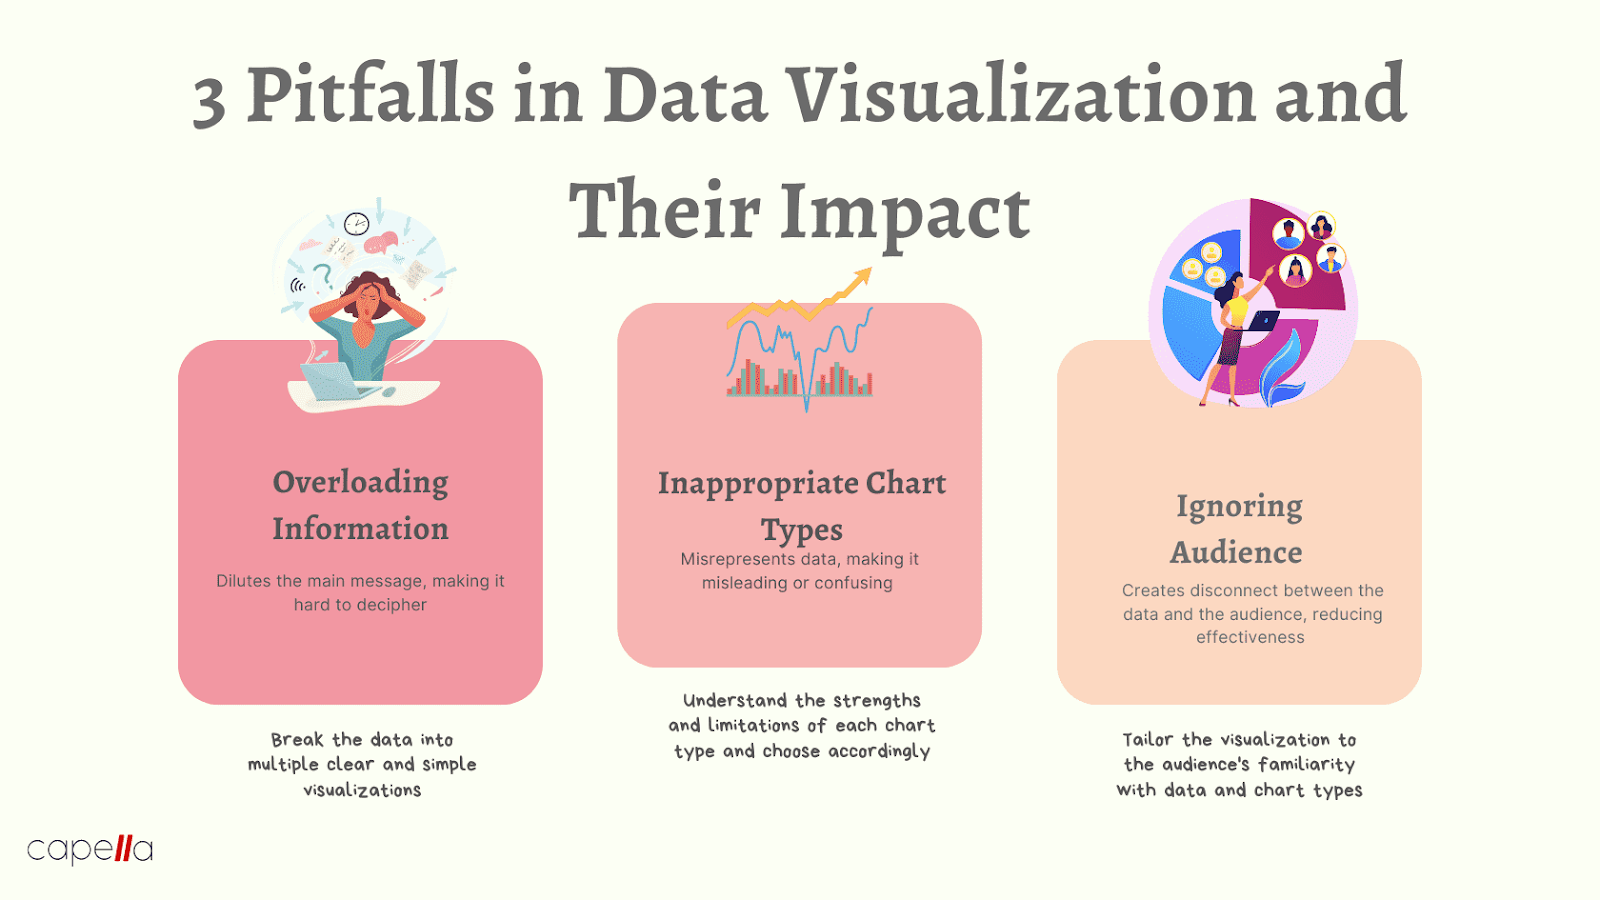
Avoiding common pitfalls in PICK chart implementation
Common pitfalls such as rushing the evaluation, ignoring low-impact ideas, or failing to update the chart can undermine the PICK chart’s effectiveness. To avoid these, allocate sufficient time for thorough analysis and include all ideas, even those initially deemed less promising, as they may gain relevance later.
Regularly revisiting and updating the PICK chart is essential, especially in fast-changing industries. For example, a small e-commerce business should review its PICK chart quarterly to reflect new customer feedback or market shifts.
Using project management platforms like Trello, Asana, or Monday.com can help track changes and keep the team aligned.
By maintaining discipline in the process and fostering continuous improvement, freelancers and small business owners can leverage PICK charts to make smarter, data-driven decisions that adapt over time.
Software tools to create pick charts
Tools such as Lean Six Sigma are pivotal in creating PICK charts as part of the Implement phase in both Lean Manufacturing and Six Sigma. These charts serve as a visual comparison aid for categorizing the ease and cost of implementation of various process improvement ideas based on the estimated return on investment (ROI).
The Impact Effort Matrix and Ease Impact Matrix are useful tools in the Identify and Prioritize Opportunities Phase. They allow teams to evaluate and prioritize action items based on their ease of implementation and potential impact. Improvement ideas can thus be evaluated and planned effectively using these tools.
Microsoft Excel and PowerPoint
Implementing Six Sigma and Lean Manufacturing concepts in a business environment often involves using tools like Microsoft Excel and PowerPoint. These platforms facilitate the ease of implementation for process improvement ideas, helping to categorize and prioritize action items.
Using Excel's data-handling capabilities allows for more in-depth visual comparison during the Identify and Prioritize Opportunities Phase.
Additionally, PowerPoint aids in presenting the Impact Effort Matrix and the Ease Impact Matrix, important Lean Six Sigma tools. These matrices help in calculating the return on investment of the proposed changes, thus assisting with decision-making in business operations.
Overall, Microsoft Excel and PowerPoint prove to be effective in driving continuous process improvement and achieving a substantial return on investment due to their data analysis and visual display functionalities respectively.
Lucidchart
Lucidchart is a vital Lean Six Sigma tool that helps categorize and implement process improvement ideas. It is particularly useful during the Identify and Prioritize Opportunities Phase, as it allows for visual comparison and easy tracking of action items.
Within this context, its benefits extend to Lean Manufacturing and Six Sigma approaches by enabling the creation of an Impact Effort Matrix and an Ease Impact Matrix. These matrices aid in measuring the return on investment and the ease/cost of implementation of improvement ideas, thereby optimizing resource allocation and enhancing overall productivity.
Above all, Lucidchart enables ease of implementation, providing a platform that effectively translates process improvement ideas into actionable and tangible plans.
SmartDraw
SmartDraw is a valuable Lean Six Sigma tool that effortlessly aids in Lean Manufacturing and Six Sigma implementations. It offers a visual comparison approach to categorize and prioritize process improvement ideas, providing an easy-to-use platform to create Impact Effort Matrix and Ease Impact Matrix.
This tool not only shortens the Identify and Prioritize Opportunities Phase but also ensures appropriate action items are promptly set. Additionally, SmartDraw provides an intuitive framework to evaluate the ease and cost of implementation, ensuring a significant return on investment through the ease of implementation of selected improvement ideas.
Common pick chart mistakes and how to avoid them
When employing PICK charts, a Lean Six Sigma tool in Lean Manufacturing, it is essential to avoid common mistakes. These blunders include failing to categorize ideas correctly, overlooking the full return on investment, and neglecting to identify the true ease and cost of implementation. To sidestep these pitfalls, consider the following strategies:
Define clear parameters
During the Identify and Prioritize Opportunities Phase, take a moment to clearly define the parameters for each category in the Impact Effort Matrix. This ensures that ideas are appropriately sorted, preventing misclassification.
Look beyond ease
While assessing process improvement ideas, don’t focus solely on ease of implementation. Consider their potential return as well. Sometimes, the simplest solutions yield the most significant benefits.
Visualize effort versus impact
Lastly, create a visual comparison of action items. Evaluate them in terms of effort versus impact. This balanced approach ensures that you’re not chasing low-hanging fruit at the expense of substantial gains.
How to avoid misjudging the effort and impact of tasks
Implementing Lean Manufacturing techniques can inadvertently lead to underestimating the effort and impact of tasks. This oversight often occurs during the Identify and Prioritize Opportunities Phase of the Six Sigma methodology. Beware—it could compromise your return on investment.
To mitigate this risk, consider leveraging Lean Six Sigma tools like the Impact Effort Matrix and Ease Impact Matrix. These tools provide a visual framework for categorizing action items based on ease/cost of implementation. By accurately assessing effort and impact, you’ll make informed decisions.
How to avoid overlooking the importance of team collaboration
In the world of Lean Manufacturing, overlooking team collaboration is a cardinal sin. Generating process improvement ideas requires collective effort. The Impact Effort Matrix can foster collaboration by visually comparing potential action items. Engage all team members during the Identify and Prioritize Opportunities Phase to maximize your Six Sigma ROI.
How to maximize the use of pick charts in your agency
In conclusion, PICK charts play a crucial role in your agency’s Lean Manufacturing and Six Sigma strategies. They help you categorize and implement process improvement ideas effectively. A PICK chart provides a visual comparison of potential returns versus implementation costs. These charts are especially valuable during the Identify and Prioritize Opportunities Phase, guiding your team toward impactful decisions. Embrace PICK charts as a vital tool for success.


'%3e%3cg id='Final-Copy-2_2_' transform='translate(1275.000000, 200.000000)'%3e%3cpath class='st0' d='M7.4,12.8h6.8l3.1-11.6H7.4C4.2,1.2,1.6,3.8,1.6,7S4.2,12.8,7.4,12.8z'/%3e%3c/g%3e%3c/g%3e%3c/g%3e%3cg id='final---dec.11-2020'%3e%3cg id='_x30_208-our-toggle' transform='translate(-1275.000000, -200.000000)'%3e%3cg id='Final-Copy-2' transform='translate(1275.000000, 200.000000)'%3e%3cpath class='st1' d='M22.6,0H7.4c-3.9,0-7,3.1-7,7s3.1,7,7,7h15.2c3.9,0,7-3.1,7-7S26.4,0,22.6,0z M1.6,7c0-3.2,2.6-5.8,5.8-5.8 h9.9l-3.1,11.6H7.4C4.2,12.8,1.6,10.2,1.6,7z'/%3e%3cpath id='x' class='st2' d='M24.6,4c0.2,0.2,0.2,0.6,0,0.8l0,0L22.5,7l2.2,2.2c0.2,0.2,0.2,0.6,0,0.8c-0.2,0.2-0.6,0.2-0.8,0 l0,0l-2.2-2.2L19.5,10c-0.2,0.2-0.6,0.2-0.8,0c-0.2-0.2-0.2-0.6,0-0.8l0,0L20.8,7l-2.2-2.2c-0.2-0.2-0.2-0.6,0-0.8 c0.2-0.2,0.6-0.2,0.8,0l0,0l2.2,2.2L23.8,4C24,3.8,24.4,3.8,24.6,4z'/%3e%3cpath id='y' class='st3' d='M12.7,4.1c0.2,0.2,0.3,0.6,0.1,0.8l0,0L8.6,9.8C8.5,9.9,8.4,10,8.3,10c-0.2,0.1-0.5,0.1-0.7-0.1l0,0 L5.4,7.7c-0.2-0.2-0.2-0.6,0-0.8c0.2-0.2,0.6-0.2,0.8,0l0,0L8,8.6l3.8-4.5C12,3.9,12.4,3.9,12.7,4.1z'/%3e%3c/g%3e%3c/g%3e%3c/g%3e%3c/g%3e%3c/svg%3e)