


A marketing agency org chart is a visual representation of the roles and responsibilities within an agency, crucial for improving accountability, communication, and decision-making. There are various types of organizational charts, such as hierarchical, matrix, and flat structures, each suited to different agency sizes and goals. For example, a hierarchical chart is ideal for larger agencies with clear departmental divisions, while a flat chart suits smaller agencies aiming for flexibility. Implementing the right org chart helps agencies optimize operations, enhance collaboration, and adapt to market dynamics, ultimately boosting productivity and client satisfaction.
An organizational chart can be highly beneficial for your agency for several reasons. Providing accountability for roles and responsibilities, fostering clear communication and collaboration, enhancing organizational efficiency, and streamlining decision-making processes are just some of them.
But there isn’t a one-size-fits-all agency organizational chart.
These charts vary across different industries, organizations, and market dynamics. Only by understanding the differences between these charts can you determine the most effective structure for your agency’s specific needs. Of course, this can also help you create or revise your own organizational chart (or org chart, for short).
Assign roles and responsibilities in a project management software
In Bonsai, there are four user roles that you can create for your team members to manage your agency efficiently:
- Owner - The owner is the one who creates the company account and has full access to everything.
- Partners - They assist in managing the company but cannot access banking details or delete the company account.
- Project Managers - They have various permissions including managing clients, projects, tasks, and time tracking. However, they cannot access financial data or certain features like editing client custom fields or viewing invoices.
- Collaborators - They can view and work on assigned projects, track time, and manage their profile settings, but cannot edit or delete projects or access financial data.
To add or remove team members and assign them a role, navigate to the Team page in your company settings.
.png)
For efficiency, ensure team members are assigned appropriate roles to maintain security and streamline project management. Regularly review and update permissions as team dynamics change. Use Bonsai's features for seamless collaboration and project tracking while limiting access to sensitive information.
Keep reading to learn about the seven most popular agency organizational charts.
1. Hierarchical organizational chart
The hierarchical organizational chart is undoubtedly the most commonly used structure to represent organizational relationships. Of course, this shouldn’t be a surprise, as most people immediately imagine a pyramid-shaped chart when visualizing an organizational structure. Let’s inspect this chart in more detail.
How is the hierarchical organizational chart structured?
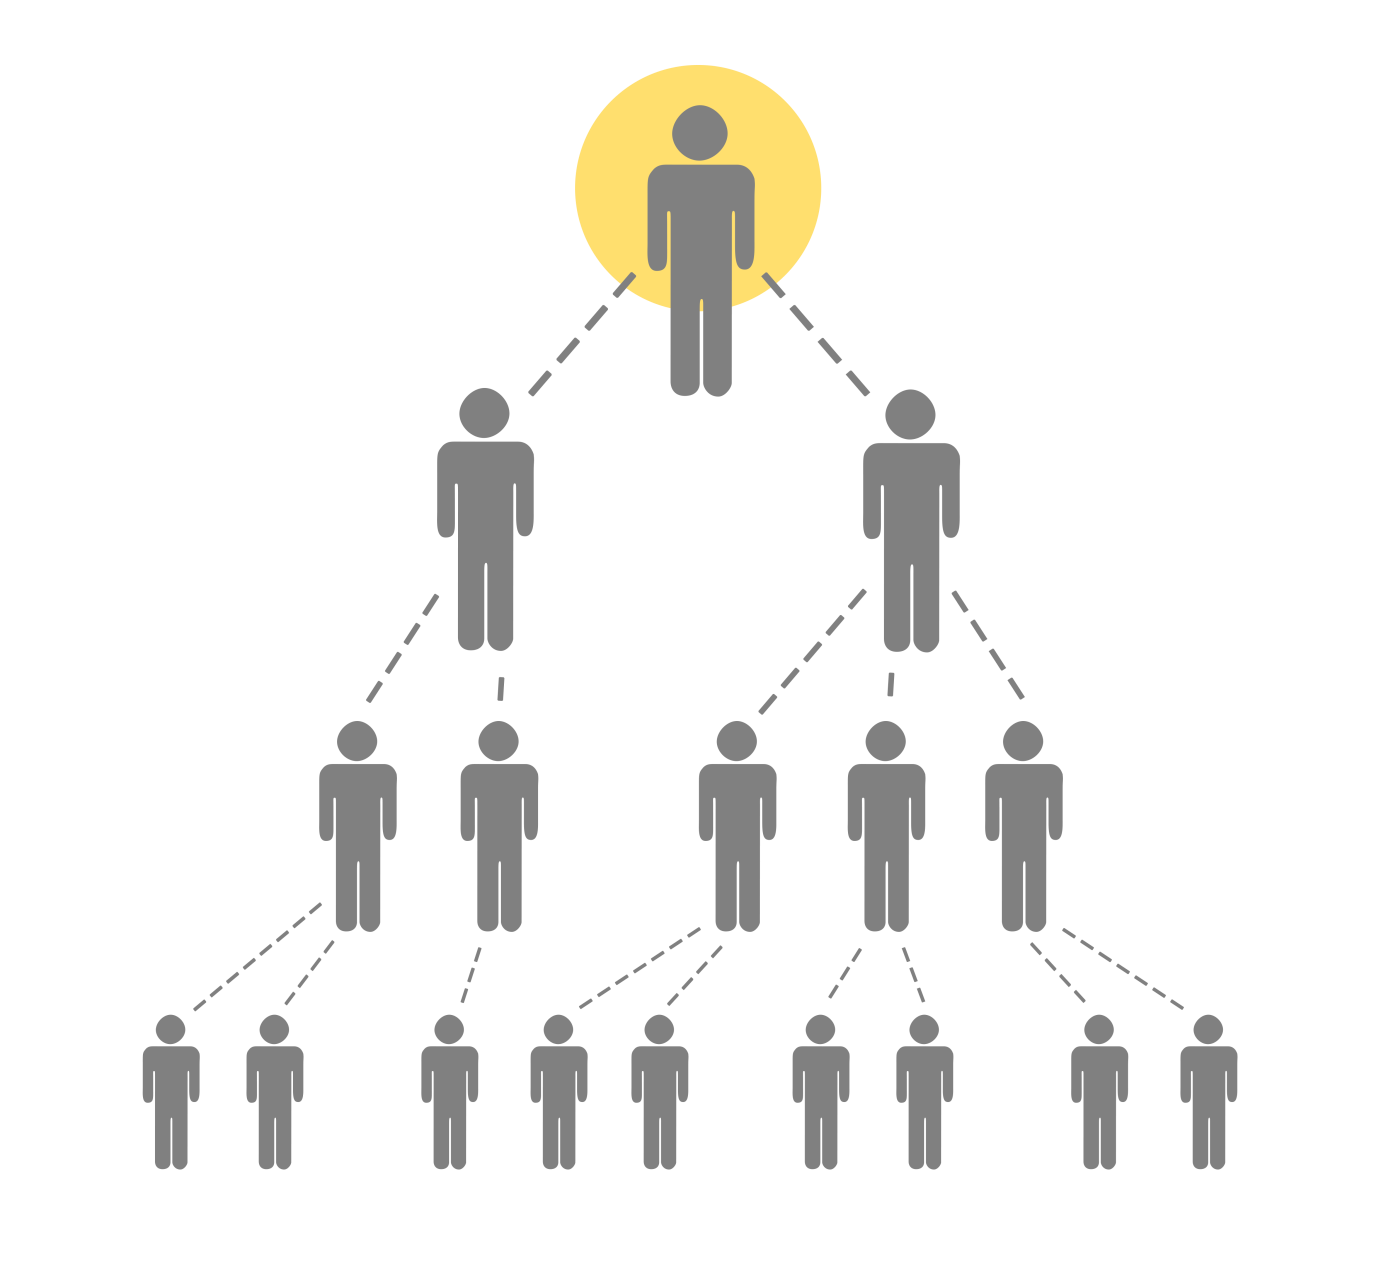
So, most people see agencies (and other businesses) as having a hierarchical structure resembling a pyramid. But what does this pyramid entail?
You’ll find the organization’s highest-ranking individual at the top of the pyramid. In most cases, this is the Chief Executive Officer (CEO). From the CEO, the chain of command moves down, with each successive tier decreasing in authority and responsibilities.
In most organizations, the CEO is followed by other C-suite executives, such as:
- Chief Operating Officer (COO)
- Chief Financial Officer (CFO)
- Chief Marketing Officer (CMO)
- Chief Technology Officer (CTO)
- Chief Information Officer (CIO)
These C-suite executives generally appear on the same horizontal line and have specific employees reporting to them. Below the agency’s C-suite executives (or directors, as they are often referred), you’ll likely find the following roles in this order:
- Senior managers and directors
- Middle managers
- Supervisors
- Full-time employees
- Part-time employees
- Contractors (which can be managed by a business management tool like Bonsai)
Of course, the exact organizational hierarchy (and, in turn, its chart) will depend on various factors, including the agency’s size, industry, and geographical location. As for the size, this chart will span as widely as needed to cover all existing departments (and hierarchies within those departments).
Who is the hierarchical organizational chart best for?
The hierarchical organizational chart is best for larger agencies and government organizations where clear lines of authority and responsibility are crucial.
Of course, you can find this popular agency organizational chart in various other organization types, such as non-profits, schools and universities, and the military. The same goes for multiple industries, like manufacturing and any other sector that prioritizes a well-established chain of command.
Hierarchical organizational chart: Pros and cons
So, now you know what hierarchical organizational charts are all about and who should use them. All that’s left is to round up their pros and cons to help you make the final decision.
Agencies that rely on hierarchical organizational charts primarily do so because these charts:
- Establish a clear line of authority (and reporting) within the agency
- Clarify roles and responsibilities
- Facilitate a systematic approach to task delegation
- Allow the agency to hire specialists for niche positions
- Establish a well-defined career path, keeping employees motivated
However, not all organizations are fond of the hierarchical organizational chart. This dislike primarily has to do with the following aspects:
- Slower decision-making processes
- A disconnect between lower-level employees and top-tier management
- A restricted downward information flow
2. Matrix organizational chart
The matrix organizational chart displays a more complex organizational structure within an agency. The complexity primarily has to do with multiple reporting obligations. Let’s elaborate on these obligations (and this structure) further.
How is the matrix organizational chart structured?
The matrix organizational structure doesn’t follow the traditional (hierarchical) model. Instead, the reporting relationships within an agency are set up as a grid, or a matrix, if you will.
All employees with similar skills are grouped for specific assignments and projects in this structure. As a result, they must report to more than one manager. Let’s give you an example to help you understand how this dual-reporting obligation works better.
Let’s say you run a marketing agency and are working on a campaign for a recognizable fitness brand. For this particular campaign, you might pool all the graphic designers, social media managers, and content creators who have experience with the fitness industry. This newly formed team will have two reporting obligations – project-based and functional.
For the former, the team will have to report to the campaign project manager (and any other stakeholder involved in the project). However, for the latter, each team member will have to report to their respective departments within the agency (i.e., the graphic design, social media management, and content creation departments).
Project-based reporting duties are usually represented as dotted lines on the matrix organizational chart instead of solid (i.e., permanent) lines for functional reporting. From this fact, you can also conclude that functional reporting generally takes precedence over product-based reporting.
Who is the matrix organizational chart best for?
The matrix organizational chart is ideal for agencies that manage multiple projects simultaneously and require frequent cross-department collaboration. The same goes for agencies that are primarily project-based or region-based. The latter agencies can significantly benefit from a matrix organizational chart, especially if there are different laws in each region where they operate.
Matrix organizational chart: Pros and cons
The primary appeal of the matrix organizational structure (and chart) is the more balanced decision-making process facilitated by two chains of command. Other advantages of this structure include the following:
- Improving resource-sharing between departments
- Enhancing communication between individual employees, teams, and departments
- Accelerating skill acquisition within teams
- Boosting efficiency and flexibility within the agency
However, the matrix organizational structure isn’t without flaws. The sheer complexity of this structure yields the following disadvantages:
- Confusion regarding roles, priorities, and authority
- Conflicts of power between the functional manager(s) and project manager(s)
- Blurred lines of accountability
3. Flat (or Horizontal) organizational chart

The flat organizational structure is characterized by few or no middle management levels between the staff and the executives. In other words, there’s less vertical hierarchy, so this structure is often called “vertical.” Here’s what the org chart for this structure looks like and when to use it.
How is the flat organizational chart structured?
As mentioned, a traditional (hierarchical) organizational chart resembles a pyramid, featuring multiple levels of directors, managers, and supervisors between the staff and the top executives. However, with the flat organizational chart, there’s no pyramid, as the middle management positions typically don’t exist. In other words, all the employees are just a few steps away from the leadership.
When depicted on a chart, this structure can take virtually any shape. With this in mind, it shouldn’t be surprising that flat structures are often referred to as “organic” structures. Unlike their mechanistic counterparts (e.g., hierarchical structure), these structures are known for their wide control span, decentralization, and loose departmentalization. These models are all about flexibility and, more importantly, collaboration.
A flat agency organizational chart can be rather detailed and somewhat complex, as one employee usually reports to more than one person. In addition, this structure generally calls for cross-department responsibilities and decision-making power.
Of course, the most crucial part of the flat org chart is that it positions numerous individuals on the same level, indicating significantly more power equity. In such an environment, employees see the higher-ups as equals or team members rather than intimidating supervisors.
But this doesn’t mean these don’t have to answer or report to anyone. It just means that the decision-making power is shared, and all employees are held equally accountable for their actions and decisions.
Who is the flat organizational chart best for?
The flat organizational chart is best for small agencies or startups with minimal hierarchy and collaborative decision-making. All the work and effort in these organizations is usually transparent, so employees can easily communicate and coordinate tasks. This is even easier when working with a business management tool like Bonsai, which can consolidate all these projects and team members in one place.
However, as these companies grow, they’ll likely switch to another model. Why? The flat structure is virtually impossible to sustain for large organizations with numerous projects and employees.
Flat organizational chart: Pros and cons
The most important aspect of having few to no middle management levels is that the agency’s employees can make decisions quickly and independently. But this isn’t the only advantage of the flat organizational chart. With this chart, agencies can do the following:
- Offer employees a high level of creative control
- Allow employees to build direct relationships with the higher-ups
- Reduce expenses
As for the disadvantages of this chart, they are as follows:
- The risk of confusion in the absence of a clearly defined chain of command
- The lack of opportunities for employee progress
- The risk of power struggles
4. Divisional organizational chart
As its name suggests, the divisional structure organizes an agency based on divisions or business units. Interestingly, each unit has its own organizational chart, reflecting its internal structure. Let’s see how this works in more detail.
How is the divisional organizational chart structured?
First things first – how does this chart divide the agency? There’s more than one answer to this question. However, this division is usually based on geographic regions or the product lines offered. Here are examples of both.
An international marketing agency might adopt the geographic divisional structure to cater to unique marketing needs and trends in specific geographic areas. For instance, these divisions can be located in North America, Europe, and Asia.
As for the product-based division, a digital advertising agency might launch separate business units for different service lines. So, social media management, content creation, and search engine optimization (SEO) units would exist. This allows the agency to excel in diverse aspects of digital marketing, as each unit delivers specialized services within its domain.
But how does this look on a chart?
Well, this structure can often be visualized as a pyramid. But this time, the top represents the joint leadership, while the next layer represents the separate business units. Then, each unit is further subdivided into functional teams or departments. In other words, each unit has its own division and, in turn, its own organizational chart.
Who is the divisional organizational chart best for?
Since this organizational structure features multiple, smaller functional units, it will particularly suit large agencies with various departments that operate independently. Of course, smaller agencies can also adopt this model. But in their cases, the division is usually process-based.
The divisional organizational model also has another form: the multi-divisional structure (the so-called M-form). In this structure, one parent company owns several semi-autonomous subsidiaries. Each subsidiary uses its parent company’s name and brand. Think of large retail companies like Target and Walmart as an example.
Divisional organizational chart: Pros and cons
The primary advantage of the divisional organizational structure is the independent operational flow. This flow guarantees that the failure of one division doesn’t threaten the existence of others. Other notable advantages include the following:
- Yielding faster responses to market changes
- Easily assigning the responsibility for actions and results
- Fostering expertise
Of course, the divisional structure isn’t perfect. Here are some of its downsides that can make you think twice about adopting this model:
- Operational inefficiencies due to the separation of specialized functions
- Higher operating costs (especially overhead)
- Difficulty transferring skills across the agency
5. Team-based organizational chart
The name of this structure is pretty self-explanatory. It’s based on teams working together toward a common goal. This structure has undoubtedly transformed how many industries work, allowing people from different fields (and world parts) to work cooperatively on the same goods and services. Here’s everything you need to know about the team-based organizational structure (and its chart).
How is the team-based organizational chart structured?
The team-based organizational structure is all about flexibility. The teams in question can be formed and disbanded as needed. That’s why it shouldn’t be surprising that the org chart for this structure is also pretty flexible. However, this chart most commonly resembles a divisional organizational chart, with teams instead of units.
With so many mentions of the word, it’s easy to conclude that this structure emphasizes the role of teams within the agency. Each team has a specific function or project focus and features individuals with diverse skills. This approach reinforces teamwork, problem-solving, and independent decision-making.
Who is the team-based organizational chart best for?
Suppose your agency heavily relies on project-based work or has teams that often change. In that case, the team-based organizational chart might be for you. You can use Bonsai to assign tasks to these teams and see how each progresses.
Team-based organizational chart: Pros and cons
The team-based organizational chart has numerous benefits, including the following:
- Free-flowing communication between employees
- Faster information flow
- More efficient problem-solving
However, this model also has a few disadvantages to keep in mind, such as the following:
- Conflicts within teams can jeopardize their efficiency
- Employees have less clear career paths
- Underperforming employees can reap the benefits of the team’s success
- Employees are less motivated due to the lack of individual recognition
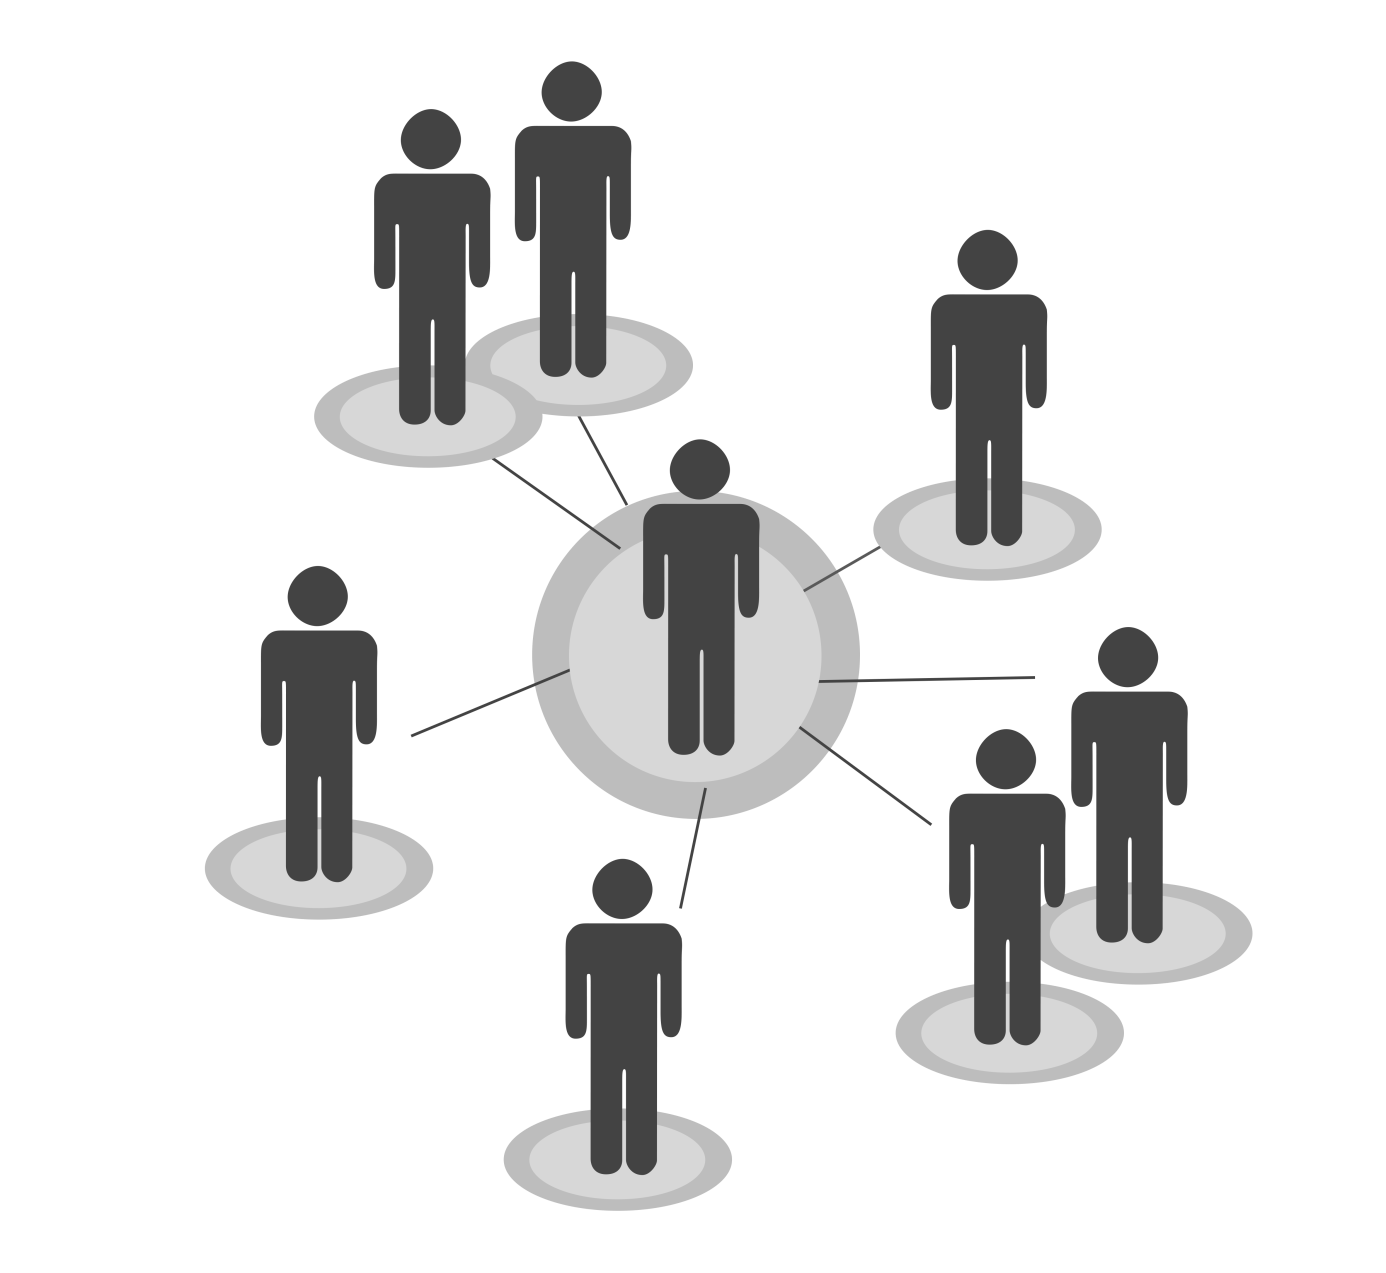
6. Network organizational chart

The network organizational chart is significantly less formal than most examples in this guide. This chart depicts the agency as a central hub connected to a network of external entities (e.g., freelancers, partners, and other stakeholders). Let’s discuss it in more detail.
How is the network organizational chart structured?
The network organizational chart can appear rather hectic. Why? Well, it doesn’t have the strict hierarchy most people know. Instead, this chart resembles a web-like structure that connects individuals (or units) based on their roles, expertise, or projects. If the chart’s appearance doesn’t already make it clear, this structure emphasizes collaboration over a linear chain of command.
Use the network agency organizational chart to instantly visualize both internal and external relationships within the organization. Of course, these relationships are also what the agency relies on. After all, there are no collaboration, knowledge and resource-sharing, and problem-solving without them.
Sure, this chart might seem complex at first glance. But the truth is that this structure is more agile, as it allows your agency to quickly adapt to changing circumstances.
Who is the network organizational chart best for?
If your agency doesn’t do everything under one roof, the network organizational structure might be for you. Creating a network organizational chart can show employees (and stakeholders) how the entire process of outsourcing works.
For instance, your employee might need help from a web designer for a specific project. Looking at the chart, they can know precisely which individual (or office) to contact.
This chart is also used when two agencies work together to share resources, as well as in partnership organizations. With the latter organizations, a network organizational chart connects the partners across different sectors, maximizing their collective impact.
Network organizational chart: Pros and cons
When it comes to agencies that often outsource projects and tasks, there’s no better option than the network organizational structure (and chart). With this model, these agencies can save a lot of money, as there’s no need to set up an entire department for the same purpose. Other benefits of the network organizational structure include the following:
- The ability to focus on core functions
- The flexibility to change processes
- The promotion of innovation and healthy competition
However, as mentioned, the network organizational structure is rather complex, which is also its biggest downside. Other disadvantages to consider include the following:
- Outsourcing the same task to multiple locations can create chaos
- Large-scale tasks might be challenging to accomplish
- Control over employees is reduced
- Confidential information can be compromised more easily
7. Circular organizational chart
At first glance, the circular organizational chart can appear drastically different from the other models described in this guide. However, this couldn’t be further from the truth. This model still relies on hierarchy; it just takes a unique visual approach. Let’s break this approach down.
How is the circular organizational chart structured?
As its name implies, this agency organizational chart is circular. Look at the center of this circle, and you’ll find the agency’s leadership (e.g., CEO). From the center, the responsibility, decision-making authority, and information flow toward the surrounding rings. And that’s where the visual difference lies. In “traditional” charts, these factors flow vertically down to the next level.
This also means that the rings around the center represent different hierarchical levels or functional units within the organization. The closer the employees are to the center, the higher their position in the organizational hierarchy. So, you’ll find entry-level employees in the outermost rings.
But if this structure is basically the hierarchical model in another package, why not just use the latter?
Well, this approach showcases all departments and employees as part of the same whole. This, in turn, encourages a sense of unity within the agency.
Thanks to this chart, the top executives aren’t seen as just sitting atop and sending directives down the command chain. Instead, they’re at the center, symbolizing their central role in guiding and coordinating the organization. This makes the circular organizational chart superior to its hierarchical counterpart from an ideological perspective.
Who is the circular organizational chart best for?
The circular organizational structure is perfect for agencies eager to emphasize collaboration and a non-hierarchical approach to organizational dynamics. Among these organizations, you’ll find consulting and creative agencies, technology startups, and research and development departments.
All of these organizations can also benefit from using a business management tool like Bonsai to help them foster a cohesive and productive environment.
Circular organizational chart: Pros and cons
The free information flow is arguably the most significant advantage of the circular organizational model. However, it’s far from the only one. This structure might appeal to you if you want to accomplish the following:
- Keeping employees aligned with the goals of the company
- Encouraging employees to collaborate between departments
- Promoting inclusive decision-making
Unfortunately, the circular organizational chart can also confuse some employees. How? The answer is simple – it doesn’t have a transparent chain of command. This makes it challenging for employees (especially the new ones) to figure out who to report to and what their place is within the organization.


'%3e%3cg id='Final-Copy-2_2_' transform='translate(1275.000000, 200.000000)'%3e%3cpath class='st0' d='M7.4,12.8h6.8l3.1-11.6H7.4C4.2,1.2,1.6,3.8,1.6,7S4.2,12.8,7.4,12.8z'/%3e%3c/g%3e%3c/g%3e%3c/g%3e%3cg id='final---dec.11-2020'%3e%3cg id='_x30_208-our-toggle' transform='translate(-1275.000000, -200.000000)'%3e%3cg id='Final-Copy-2' transform='translate(1275.000000, 200.000000)'%3e%3cpath class='st1' d='M22.6,0H7.4c-3.9,0-7,3.1-7,7s3.1,7,7,7h15.2c3.9,0,7-3.1,7-7S26.4,0,22.6,0z M1.6,7c0-3.2,2.6-5.8,5.8-5.8 h9.9l-3.1,11.6H7.4C4.2,12.8,1.6,10.2,1.6,7z'/%3e%3cpath id='x' class='st2' d='M24.6,4c0.2,0.2,0.2,0.6,0,0.8l0,0L22.5,7l2.2,2.2c0.2,0.2,0.2,0.6,0,0.8c-0.2,0.2-0.6,0.2-0.8,0 l0,0l-2.2-2.2L19.5,10c-0.2,0.2-0.6,0.2-0.8,0c-0.2-0.2-0.2-0.6,0-0.8l0,0L20.8,7l-2.2-2.2c-0.2-0.2-0.2-0.6,0-0.8 c0.2-0.2,0.6-0.2,0.8,0l0,0l2.2,2.2L23.8,4C24,3.8,24.4,3.8,24.6,4z'/%3e%3cpath id='y' class='st3' d='M12.7,4.1c0.2,0.2,0.3,0.6,0.1,0.8l0,0L8.6,9.8C8.5,9.9,8.4,10,8.3,10c-0.2,0.1-0.5,0.1-0.7-0.1l0,0 L5.4,7.7c-0.2-0.2-0.2-0.6,0-0.8c0.2-0.2,0.6-0.2,0.8,0l0,0L8,8.6l3.8-4.5C12,3.9,12.4,3.9,12.7,4.1z'/%3e%3c/g%3e%3c/g%3e%3c/g%3e%3c/g%3e%3c/svg%3e)